GBP/USD Price Analysis: Downside bias halts for a while on hammer formation
-
A hammer candlestick formation indicates that pound bulls are trying to make a comeback.
-
Declining 10-and20- EMAs still favors a downside bias.
-
An oversold situation by the RSI (14) cannot be ruled out.
The GBP/USD pair has advanced firmly after dropping to near 1.0356 as a responsive buying action kicked in. In the Asian session, the cable delivered an upside break of the consolidation formed in a narrow range of 1.0633-1.0724. The asset is expected to extend its gains above 1.0800 and will march towards 1.0900 ahead.
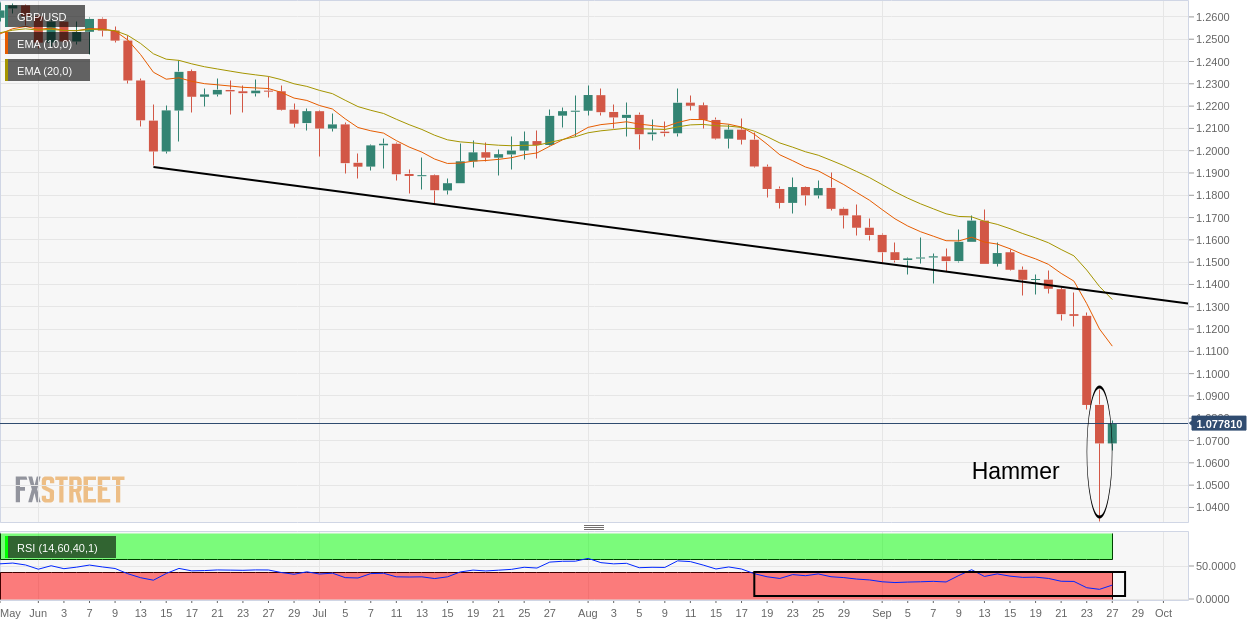
On a daily scale, the formation of a long Hammer candlestick pattern has triggered the chances of a pullback ahead. The formation of the above-mentioned single candlestick pattern indicates an activation of a ‘value bet’ phenomenon after an asset decline like a house of cards. Also, the downward sloping trendline placed from June 14 low at 1.1934 will act as a major barricade for the counter.
The 10-and-20-period Exponential Moving Averages (EMAs) at 1.1120 and 1.1335 are declining sharply, which adds to the downside filters.
Also, the Relative Strength Index (RSI) is oscillating in a bearish range of 20.00-40.00 for a longer period. Therefore, an oversold situation cannot be ruled out.
A break above Monday’s high at 1.0931 will activate the Hammer formation and will send the cable towards the round-level resistance at 1.1000, followed by 10-EMA at 1.1120.
On the flip side, the cable will lose significance further if drops below Monday’s low at 1.0339, which will drag the asset towards the round-level support at 1.0200. A slippage below the latter will direct the cable towards parity.
GBP/USD daily chart