WTI Price Analysis: Consolidates gains below $70.00 inside fortnight-old rising channel
- WTI bounces off intraday low but stays negative for the second consecutive day.
- Bullish chart pattern, sustained break of monthly hurdle favor buyers.
- Early May tops add to the downside filters.
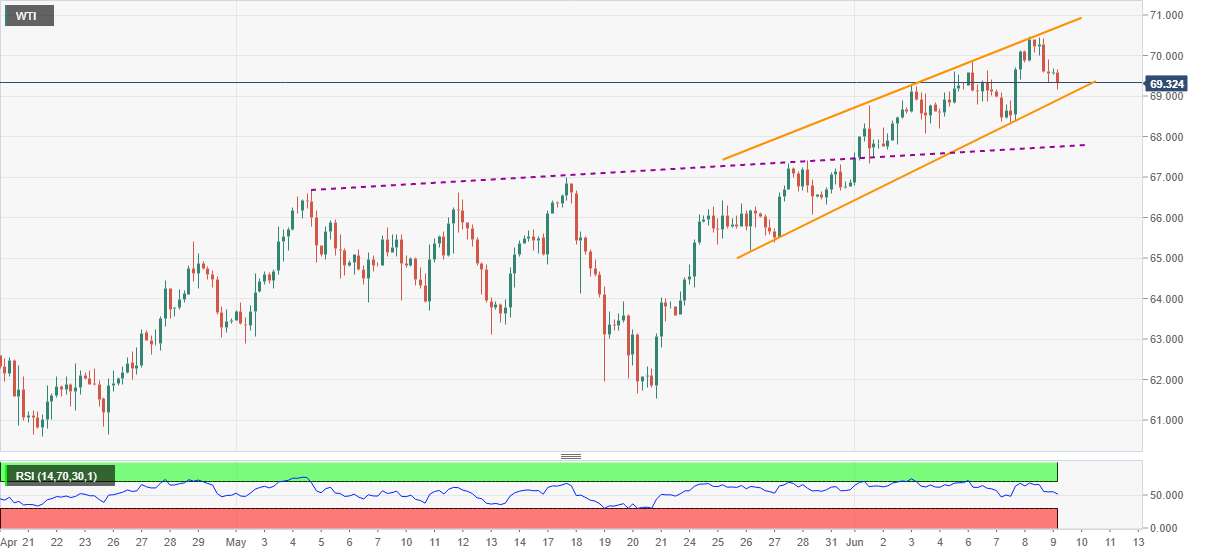
WTI licks its wounds around $69.30, down 0.43%, ahead of Thursday’s European session. Even so, the black gold remains inside a two-week-long bullish chart pattern, ascending trend channel, amid above 50.00 RSI conditions.
Hence, energy bulls may remain hopeful unless the quote breaks the stated channel’s support line, at $68.90 by the press time.
Although the channel breakdown directs WTI sellers to May 27 low near $65.17, an ascending trend line from May 05, near $67.70, as well the initial May month top close to $66.70, can provide halts to the south-run.
Alternatively, the corrective pullback could aim for a $70.00 threshold before targeting the latest swing high near $70.48.
However, any further upside will be tested by the channel’s resistance line close to $70.70.
WTI four-hour chart
Trend: Bullish