Back
7 Oct 2020
US Dollar Index Price Analysis: The 55-day SMA holds the downside… so far
- DXY looks side-lined above the 55-day SMA on Wednesday.
- The 6-month resistance line lines up just above 94.00.
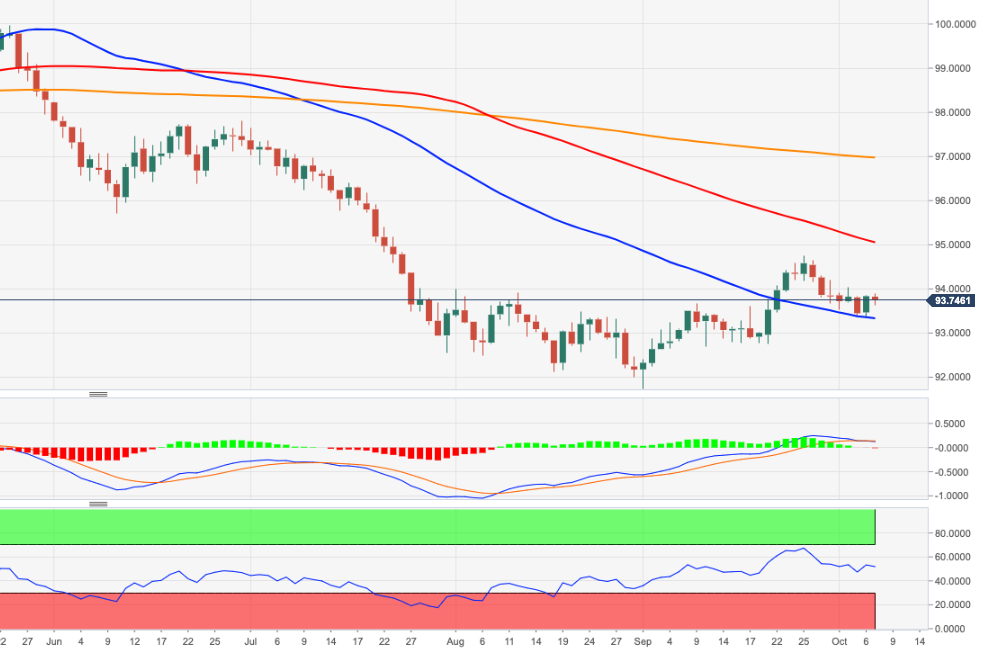
DXY keeps the choppy trade unchanged so far this week, always with the 55-day SMA in the 93.30 region acting as a strong support.
A breach of this level should put the key support area around 92.70 back on the radar while occasional bullish attempts are expected to face initial hurdle above the 94.00 barrier, where converge a Fibo level and the 6-moonth resistance line.
While below the 200-day SMA, today at 96.97, the negative view on the dollar is expected to prevail.
DXY daily chart