USD/CAD Price Analysis: Clings to 200-week SMA, 1.3100 in the spotlight
- USD/CAD remains on the back-foot near the seven-month low flashed on Monday.
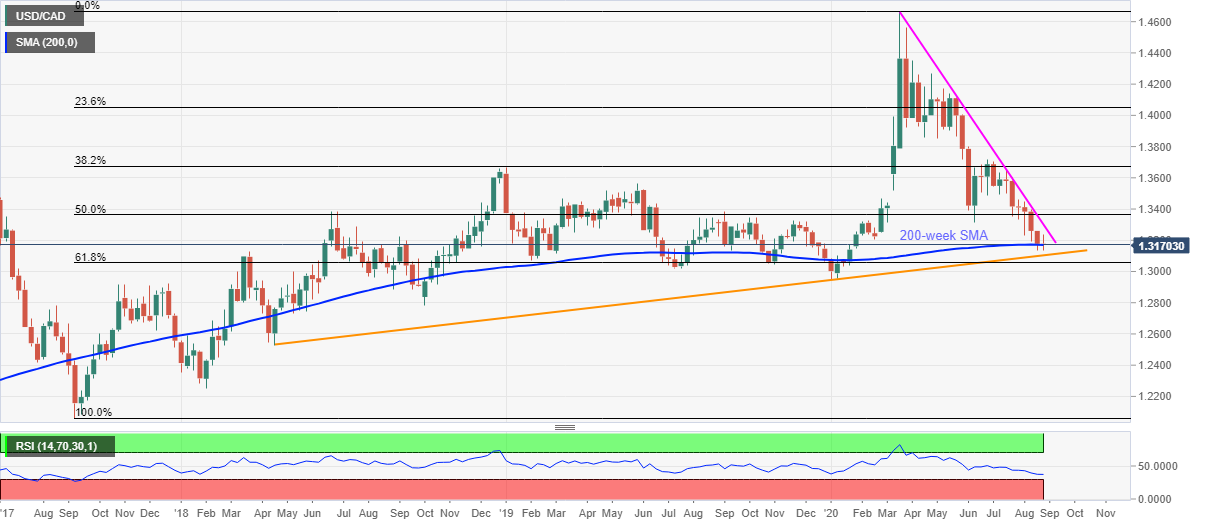
- The key SMA probe bears ahead of an ascending trend line from April 2018.
- A falling trend line from March offers immediate resistance.
USD/CAD stays pressured around 1.3170 amid the initial Asian session on Wednesday. The loonie pair slumped to the fresh low since late-January on Monday before bouncing back to 1.3217. Though, Tuesday’s selling defied hopes of the pair’s upside even if 200-week SMA confined the latest moves.
Considering the sluggish conditions of RSI and the pair’s sustained trading below the five-month-old resistance line, sellers are likely to keep the reins, which in turn can drive the quote towards the fresh seven-month low around 1.3100, comprising an ascending trend line from April 2018.
In a case where the pair fails to bounce off 1.3100, 61.8% Fibonacci retracement of 2017-20 upside, near 1.3055, will entertain the bears ahead of the 1.3000 thresholds.
Meanwhile, the buyers will look for entries past-1.3300 with the June month’s low of 1.3315 likely offering additional upside filter.
In doing so, the bulls can target May 2019 top surrounding 1.3565 while late-July peak close to 1.3470 may pose as a buffer.
USD/CAD weekly chart
Trend: Bearish