GBP/JPY meets resistance at a significant zone on the daily chart
- GBP is in a lull today after no real news from Boris Johnson's meeting with the EU commission materialised.
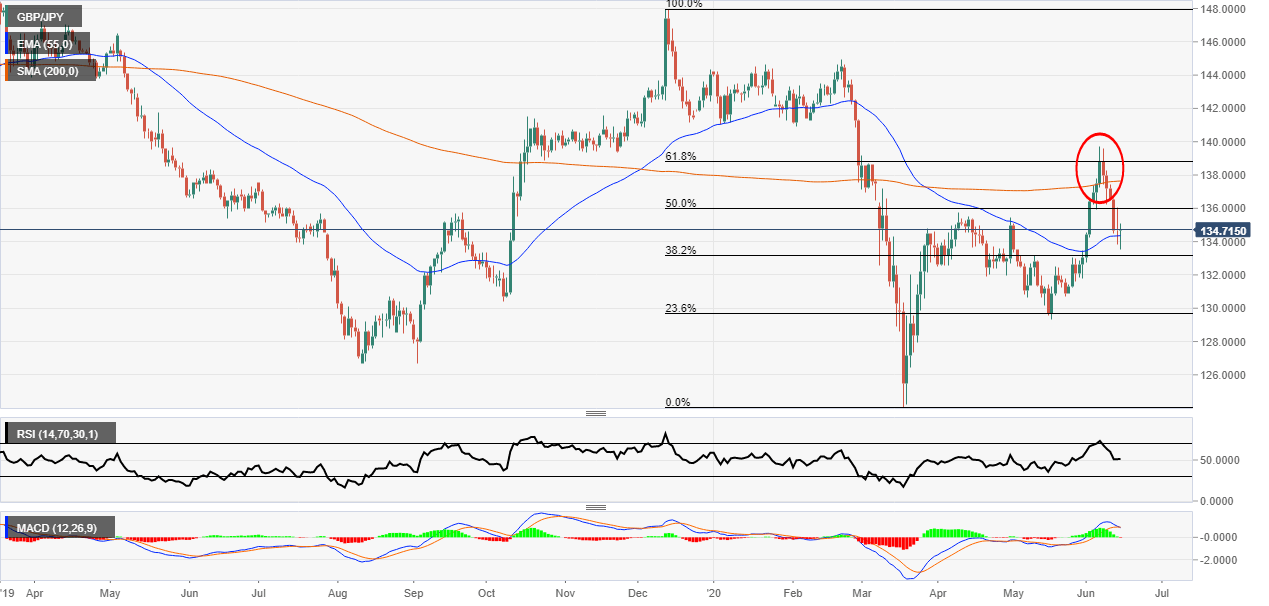
- The price found some resistance ahead of 140.00 as the 200 Simple Moving Average held firm.
GBP/JPY daily chart
Sterling has not been very volatile in the session after there was no real news from the meeting between UK PM Boris Johnson and the EU commission on Brexit. At the end of last week, GBP was one of the worst performers as a wave of USD strength kicked in and the pound sold-off due to Brexit uncertainties.
The yen has been acting as a safe haven but as the equities sell-off began it held up much better than most of the G10 counterparts against the USD tirade.
Looking at the chart below, the price met some strong resistance at the 200 Simple Moving Average (SMA). This level also matched with the 61.8% Fibonacci zone which added to the strength of the level.
The Relative Strength Index was also looking overbought and the price could have needed a retracement in either case. The MACD signal lines have crossed over and the price could keep moving lower as the histogram looks like it might be turning red too.
If the stock market keeps moving lower over the week and the Brexit negotiation get worse there could be more downside to come from this pair. But as with anything Boris could work a wonder deal as he did with Irish PM Leo Varadkar in a previous round of talks.
Additional levels