WTI Price Analysis: Rising wedge on H1 keeps sellers hopeful
- WTI probes 200-HMA inside a bearish technical formation on the hourly (H1) chart.
- Further upside could aim for the weekly top, sellers can target $10.00 following the pattern’s confirmation.
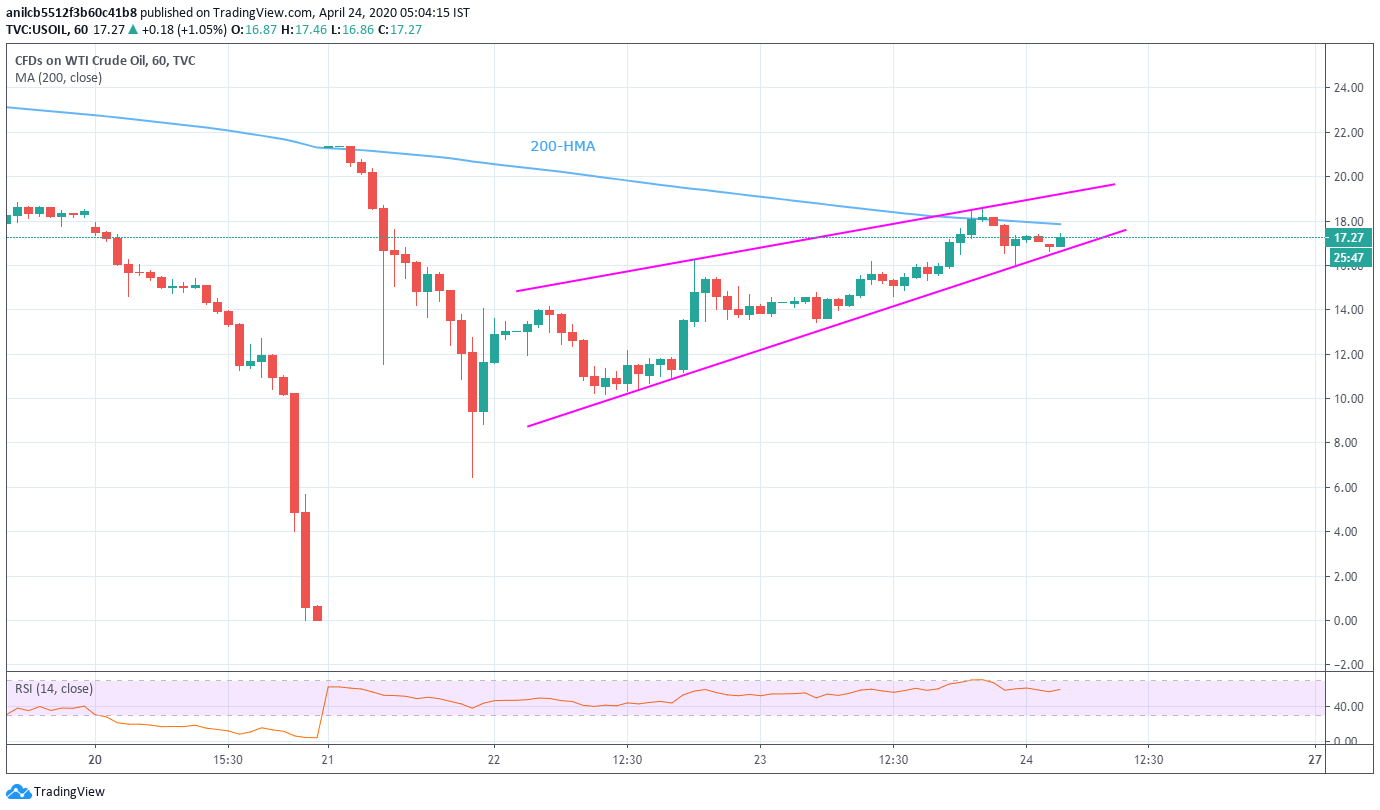
WTI registers mild gains of 1.14% while taking the bids to $17.30 during the early Asian session on Friday. In doing so, the black gold stays inside a short-term rising wedge bearish formation while probing 200-HMA.
Should buyers manage to extend the recovery moves beyond the technical pattern’s resistance line of $19.15, need to mention about the sustained break of $17.90 comprising 200-HMA level, $20.00 can offer an intermediate halt to the rally towards the weekly top near $21.30.
On the contrary, a downside break of $16.60 will confirm the bearish formation and drag the quote to $10.00.
Additionally, the energy benchmark’s inability to stay calm around $10.00 can drag it to the sub-$7 area during the further downside.
It’s worth mentioning that the commodity’s recent recovery is backed by upbeat RSI conditions and is preceded by the huge declines, which in turn favors further pullback.
WTI hourly chart
Trend: Further recovery expected