AUD/JPY Price Analysis: Heavy below 21-day SMA
- AUD/JPY remains on the back foot, stays below 21-day SMA.
- 10-day SMA remains as the near-term key support.
- Bullish MACD questions sellers.
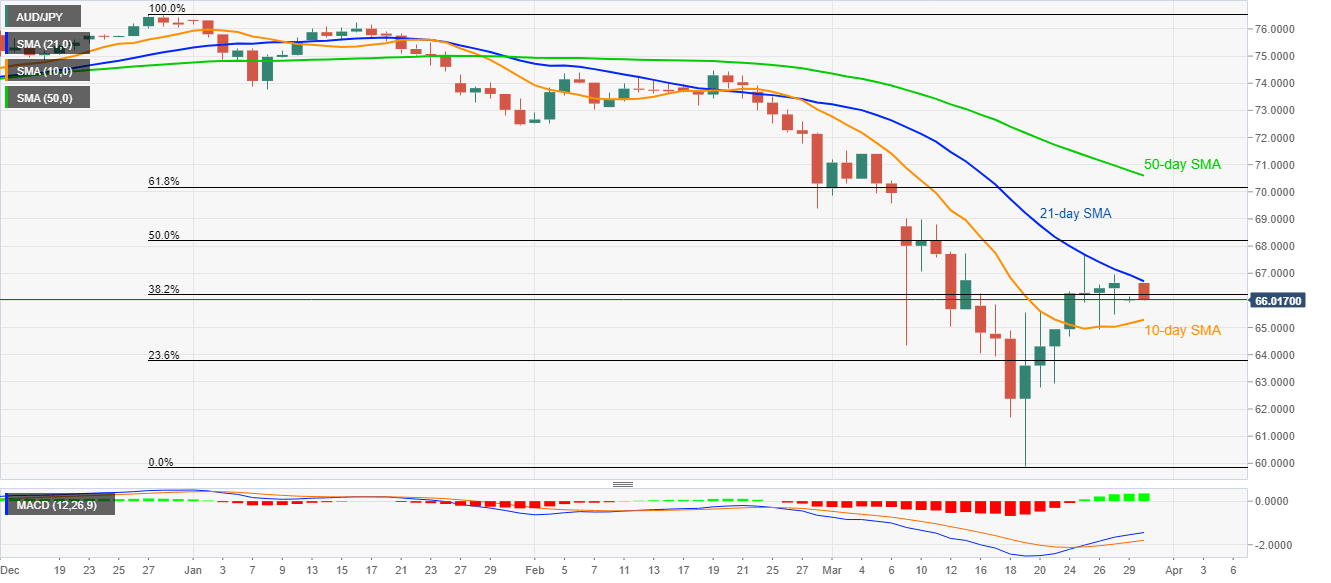
While portraying another failure to cross 21-day SMA, AUD/JPY drops to 66.02 during the early Asian session on Monday. In doing so, the pair slips below 38.2% Fibonacci retracement of its December 2019 to March 2020 fall.
That said, the quote currently declines towards a 10-day SMA level of 65.30. However, bullish MACD conditions are keeping buyers hopeful.
Should there be a clear break below 65.30, 23.6% Fibonacci retracement level of 63.78 and 62.40/35 can please the bears.
On the upside, a daily closing beyond a 21-day SMA level of 67.00 could trigger the pair’s run-up to 68.20 comprising 50% Fibonacci retracement.
However, March 09 high near 69.00 could check the buyers afterward, if not then 70.00 and 50-day SMA near 70.60 could gain the bulls’ attention.
AUD/JPY daily chart
Trend: Pullback expected