Back
31 Oct 2019
US Dollar Index technical analysis: DXY registers its worst monthly decline since January 2018
- The US Dollar Index (DXY) is under heavy bearish pressure as the Greenback sees its worst month in 21 months.
- The market may weaken further to the 97.00/96.70 support zone in November.
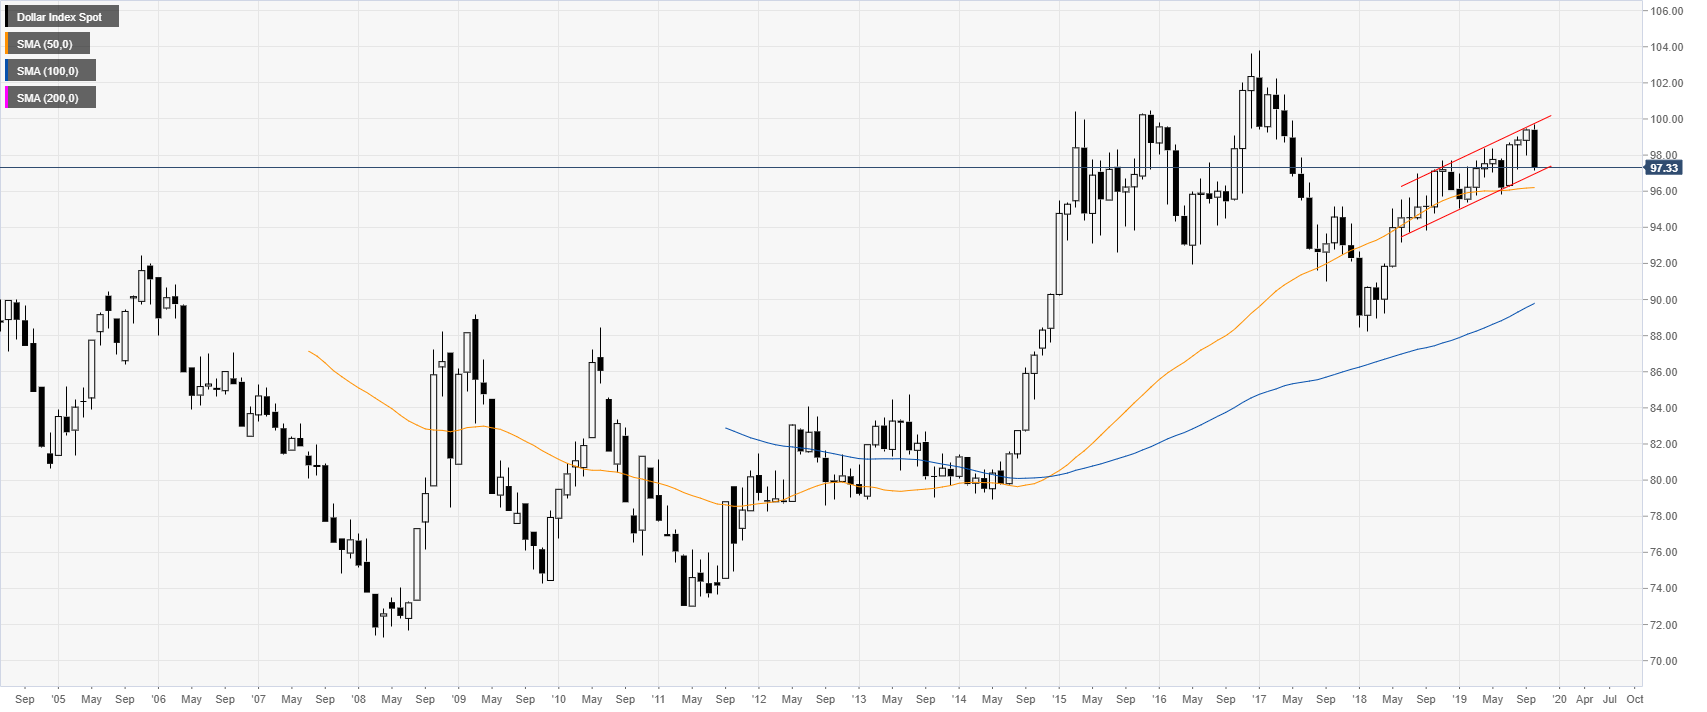
DXY monthly chart
The US Dollar Index (DXY) is trading in a bull channel above its 50 and 100-period simple moving averages (SMAs) on the monthly chart. This month has been the worst month for the Greenback in the last 21 months.
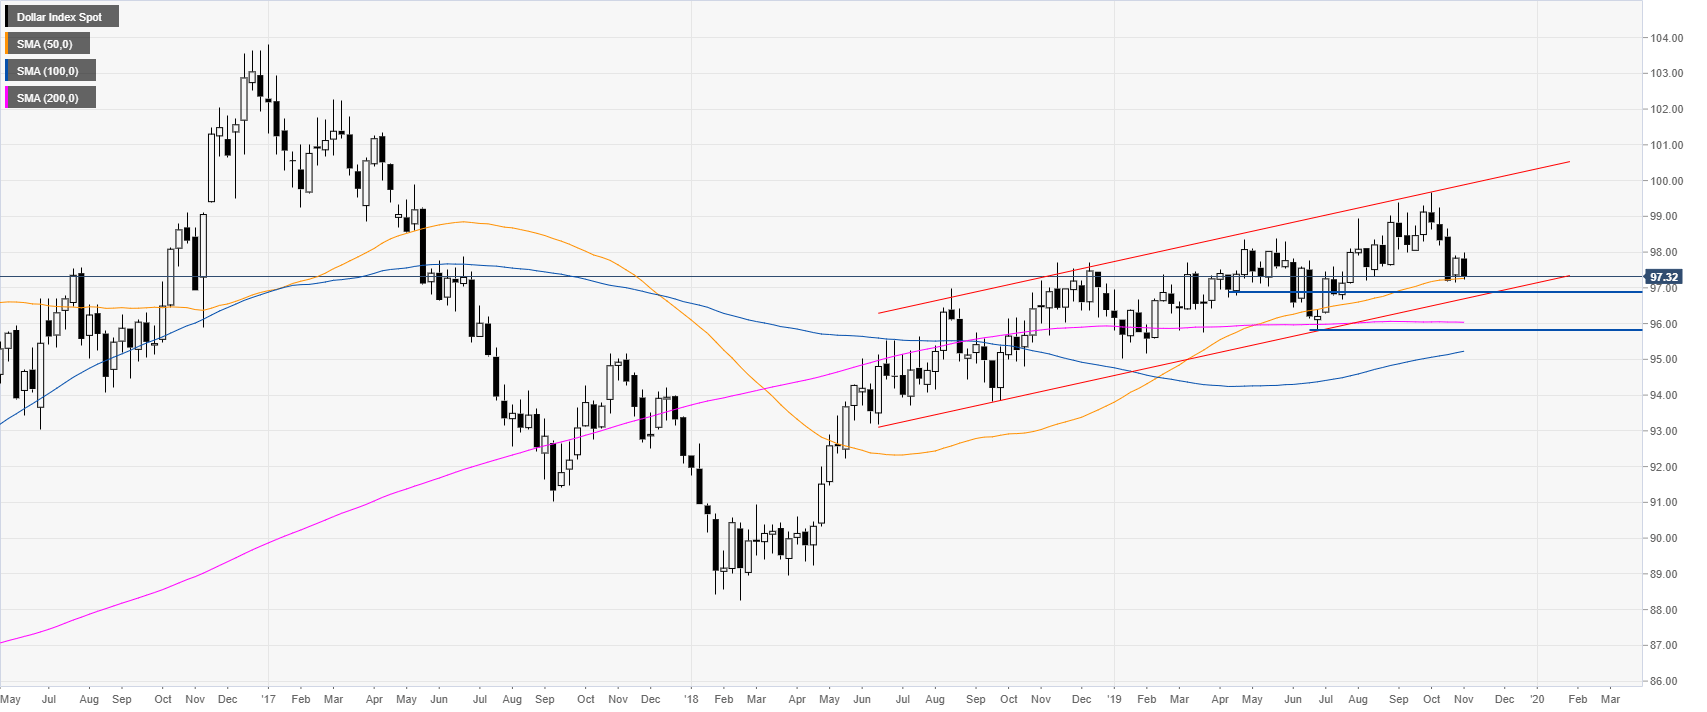
DXY weekly chart
The Index is trading just above its 50 SMA on the weekly chart as the week is closing near its low. Since the channel has been holding for many months there is a reasonable chance that the Greenback will stay supported. However, if the bears break below the 97.00/96.70 support zone, the market may drop towards the 95.84 swing low.
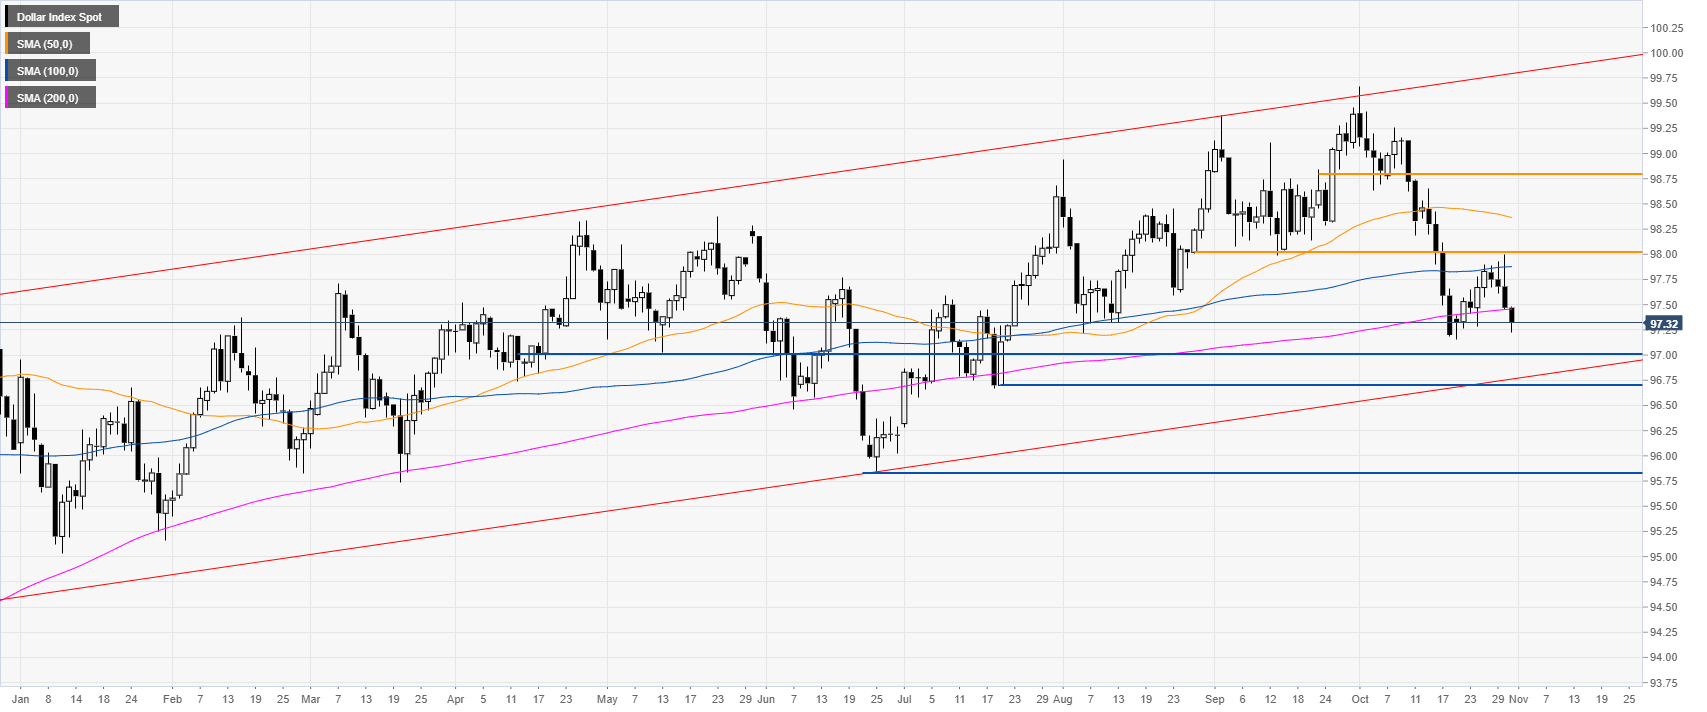
DXY daily chart
On the daily chart, the drop in October was rater relentless and the market is now trading below its main SMAs. A drop to 97.00/96.70 seems almost inevitable at this point. On the flip side, the levels to beat for bull are the 98.00 handle and 98.80 levels.
Additional key levels