Back
1 Apr 2019
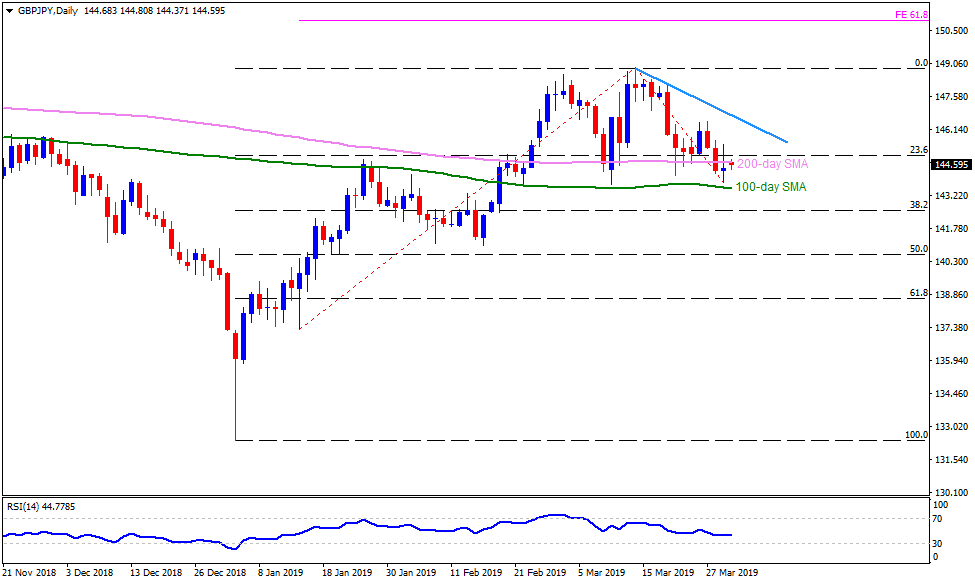
GBP/JPY Technical Analysis: Sellers lurk around 200-day SMA, signal 143.80 return
GBP/JPY daily chart
- GBP/JPY is taking the bids near 144.70 during early Monday.
- The pair struggles with the 200-day simple moving average (SMA) level of 144.70 to justify its strength while 143.80 and 100-day SMA level of 143.55 provide immediate support.
- Should the pair successfully cross 144.70 upside barrier, it can rise to 23.6% Fibonacci retracement of its January to March upside, at 145.00. Though, 145.80 and March 27 high near 146.50 could challenge buyers then after.
- Meanwhile, pair’s dip beneath 143.55 might not hesitate to recall 38.2% Fibonacci retracement level near 142.55 ahead of pleasing bears with 141.00.
GBP/JPY 4-Hour chart
- The 143.85-75 support-area could validate the quote’s downside towards 143.00 ahead of pushing sellers to aim for 142.55.
- On the upside, 23.6% Fibonacci retracement of February to March moves near 147.00 can act as additional resistances.

GBP/JPY hourly chart
- Two resistance-lines around 145.20 and 145.90 can offer extra halt during the increase.
- 144.20 may become the closest support.
