Back
29 May 2023
NZD/USD Price Analysis: Bulls moving in for possible run towards trendline resistance
- NZD/USD bulls coming into the market.
- Bearish impulse could be on the verge of a significant correction.
NZD/USD bears are lurking in a shallow correction of the daily bearish impulse as the following will illustrate in a top-down analysis starting on the daily chart.
NZD/USD daily chart
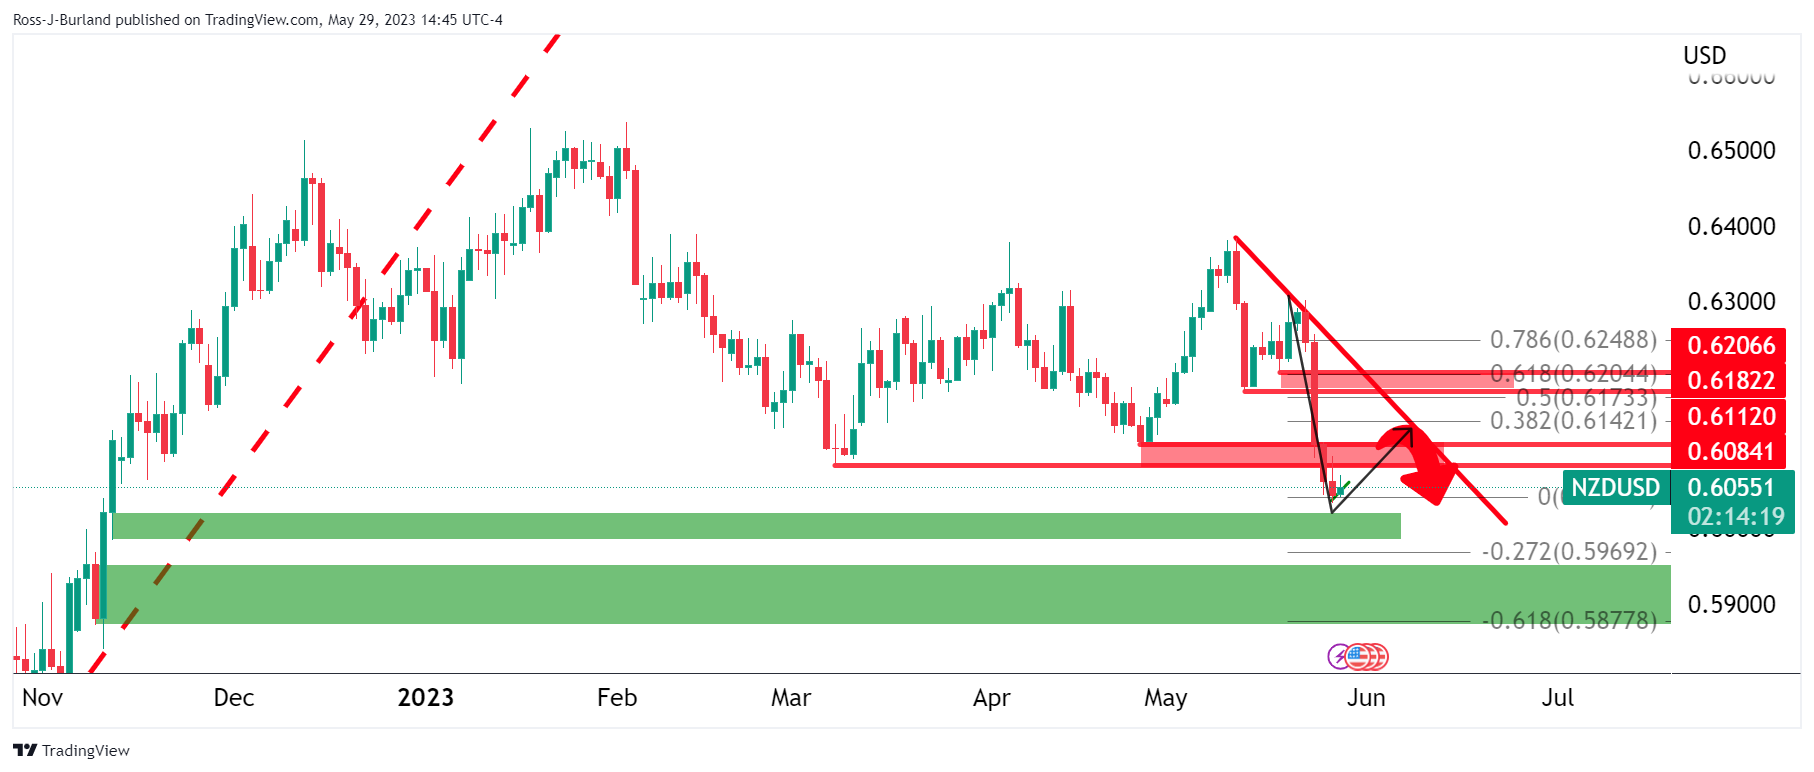
The price is embedded below prior support structure that could now be expected to act as resistance on the correction.
However, if bears fail to fend off the bulls, the Fibonacci scale will then come into focus near 0.6150 which guards a move to test the trendline resistance.
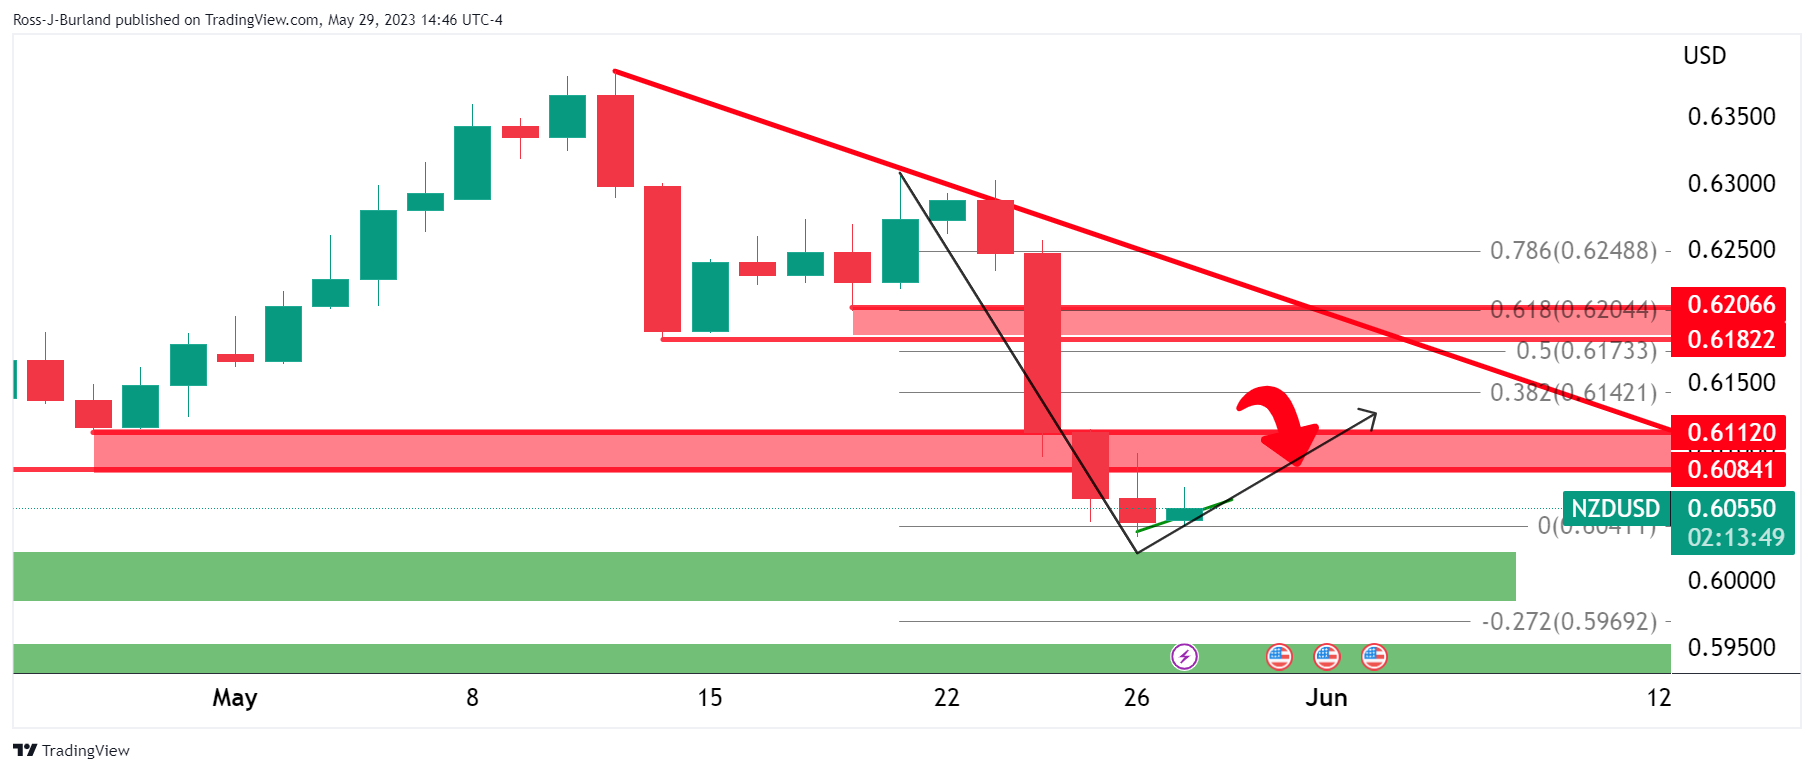
NZD/SD H4 chart
The price may already be on the verge of extending lower on a break of support.
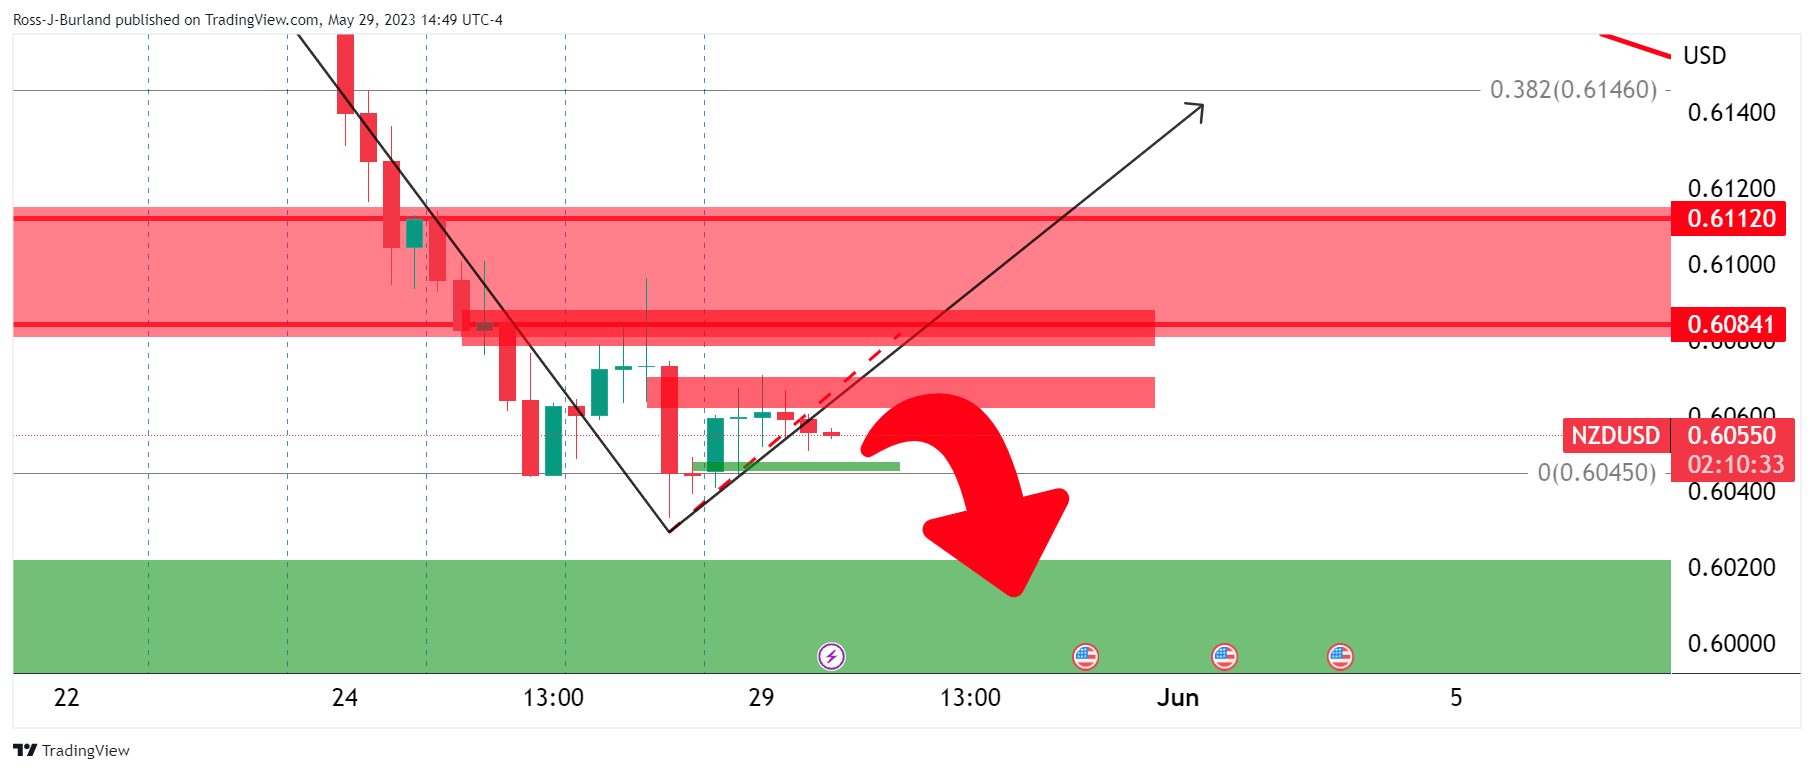
NZD/USD H1 chart
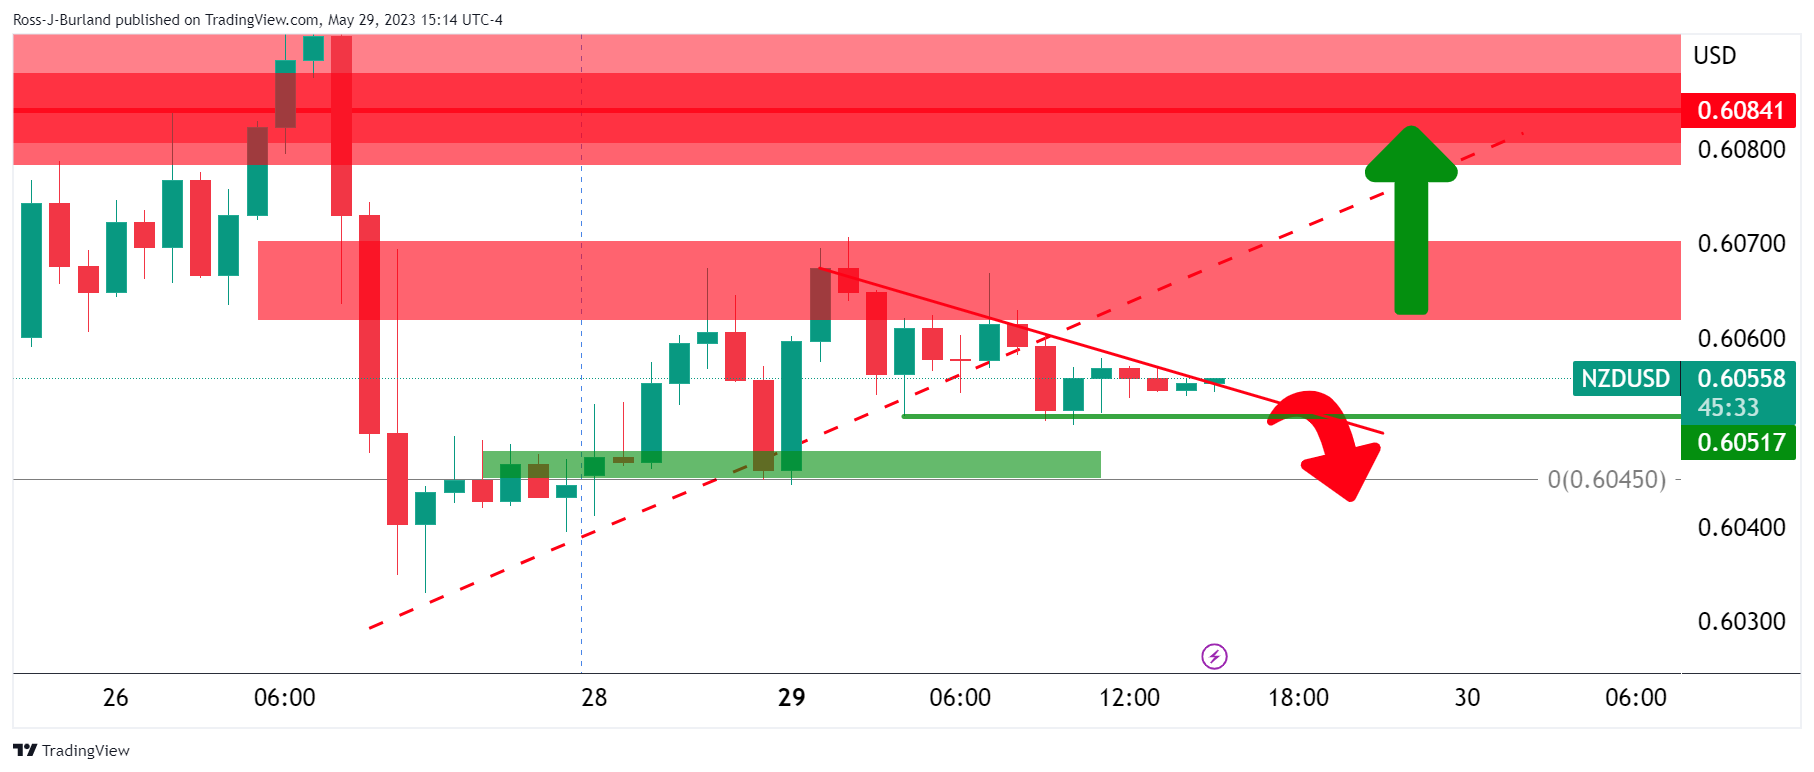
On the hourly chart, 0.6050 is an important support level that guards risk to restest the lows.